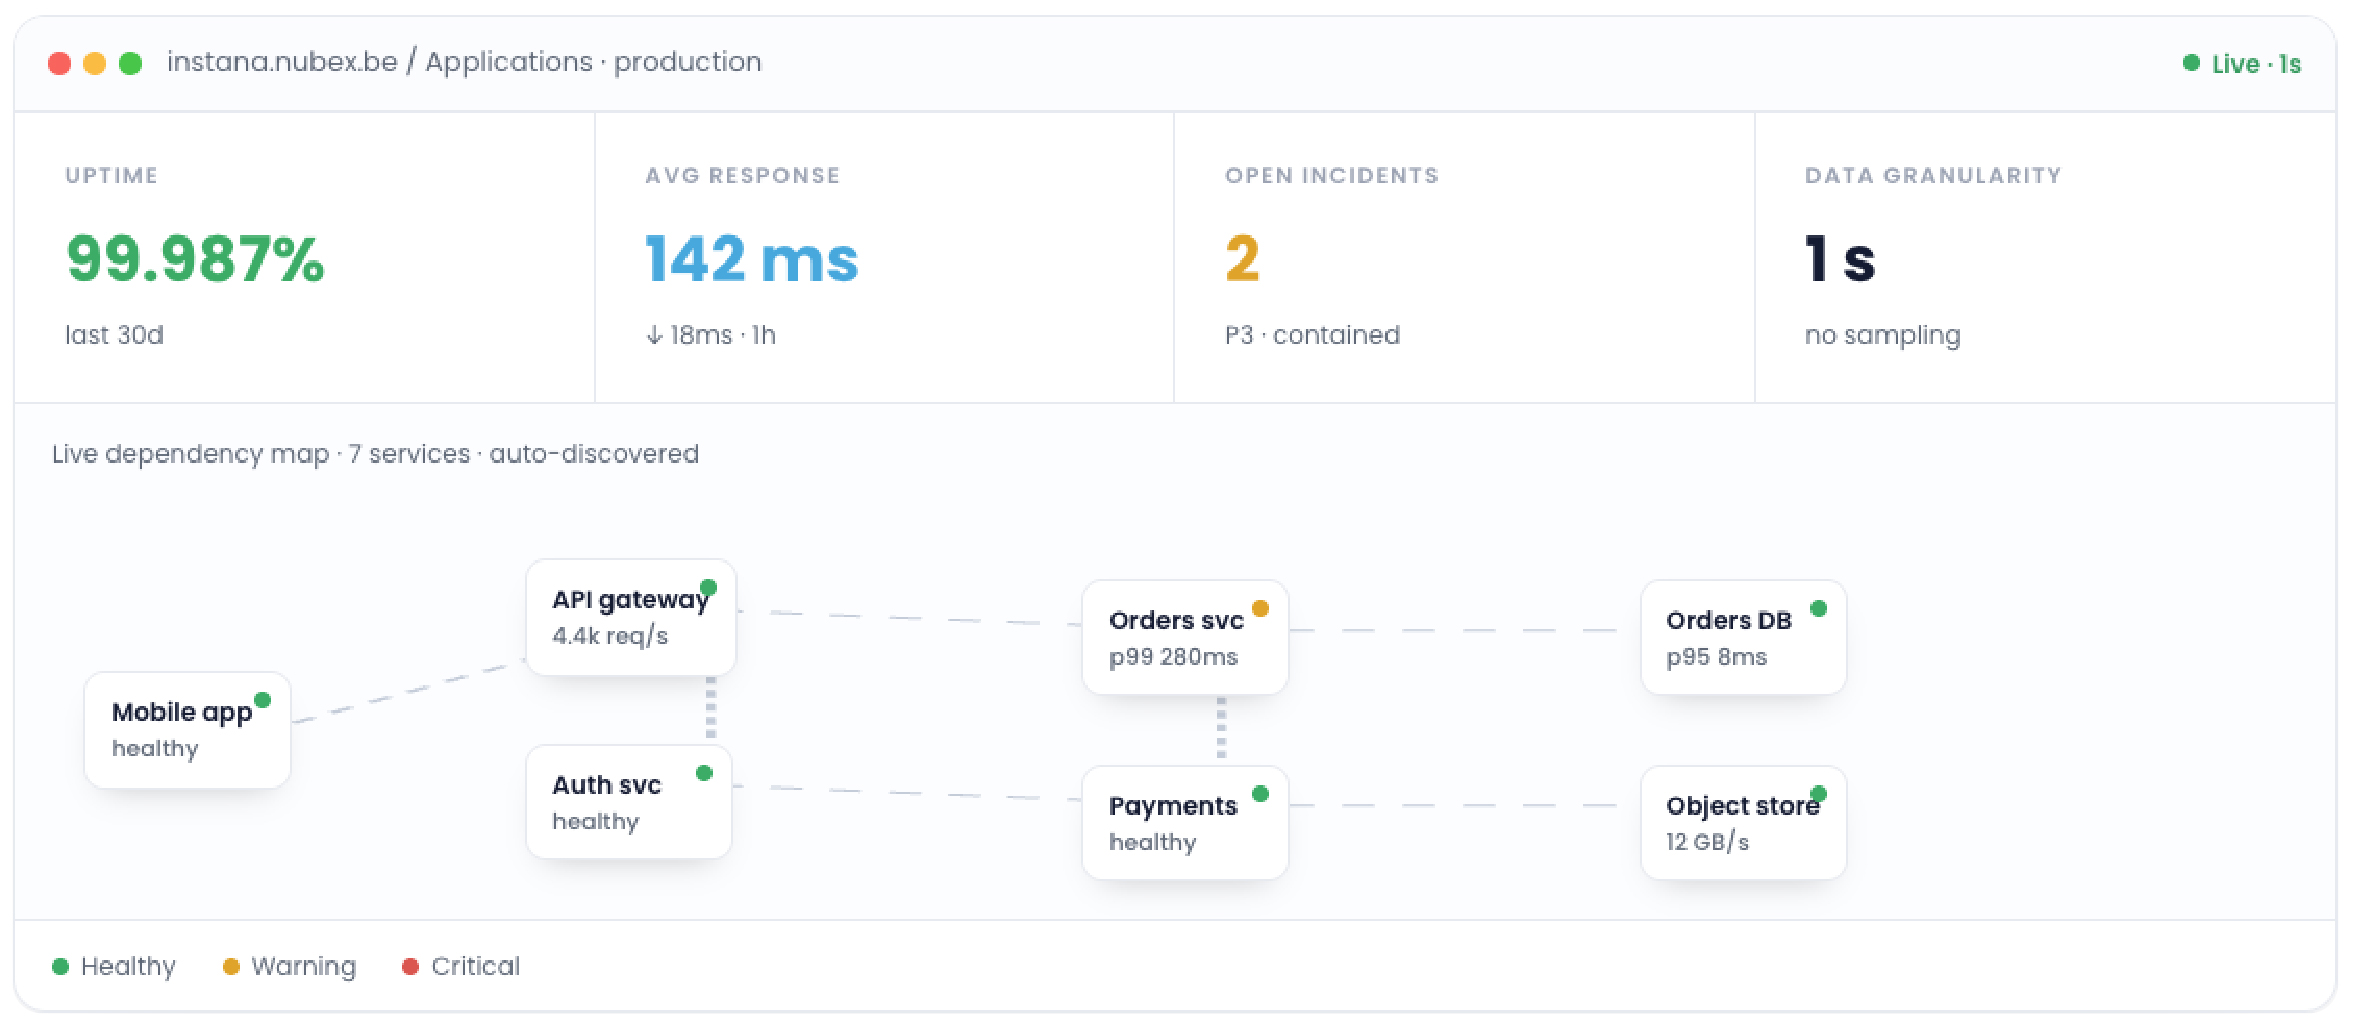
Real-time visibility across your whole stack, with root cause found automatically, from the mobile app down to storage. NubeX helps you acquire Instana, set it up, and run it, at a cost that stays predictable as you grow.
Second
Data granularity, with 100% capture and no sampling.
% faster
problem detection and resolution (SIXT, via IBM)
% lower
monitoring cost (Leaf Group, via IBM).
/WHAT INSTANA DOES
Instana runs on three principles: context, AI, and automation. It discovers your services automatically, maps how they depend on each other, and surfaces the root cause of an issue in realtime. From any starting view, you can reach the underlying problem in just a few clicks.
/APPROACH
We do more than just hand you a tool. We start from your situation, automate the heavy lifting, and keep your costs under control as you scale.
We start vendor-neutral, mapping your stack and recommending the right fit, whether that is Instana, Prometheus or Grafana. Selection runs through our experienced Covalens team.
A single agent and automatic discovery get you real data fast, with basic instrumentation live in days, not months. We provide a clear implementation plan and guide you from start to finish.
Onboarding, instrumentation and alerting are defined as code and wired into your ITSM and tools like PagerDuty, so monitoring scales by itself.
We operate and tune your setup, add AIOps for faster root cause, and keep costs predictable per host as you grow.
/COMPLIANCE
Monitoring and logging touch personal data, so what you collect and where it lives matters. With Instana you have control, install it on-premise or use Instana SaaS inside the EU, and we help you filter sensitive data at the source. For NIS 2 and DO RA, we help you do what they ask: stay in control of critical applications, detect issues quickly, and recover while maintaining full auditability in your ITSM system.
/TARGET AUDIENCE

See everything that runs end-to-end, from the mobile app to storage, with SLAs, SLOs and business KPIs in one place.

Pricing scales per host with your infrastructure, not with data volume or the number of JVMs. No surprises as you grow.

Trace the failing query, pod or deployment in clicks, with code-level detail and release markers that tie issues to what changed.

Automatic discovery, onboarding via infrastructure as code, and root cause across the entire stack. Less fighting, more building.
/SERVICES
Wherever you are, we pick it up. We start vendor-independent and take it as far as you want, up to a fully managed service.
Independent advice on the right tool for you, whether that is Instana, Prometheus & Grafana, or something else. We can support your RFI or RFP, too.
Platform setup, agent rollout and instrumentation, so you are seeing real data fast.
We operate, maintain, and automate your monitoring with infrastructure as code, and wire alerts into your ITSM and tools like PagerDuty.
Ask your monitoring questions in plain language, and add autonomous agents that investigate and resolve incidents in minutes.
Hands-on training for your mobile, frontend and backend teams, from instrumenting the app and website to building custom dashboards.
Run it fully managed by us, run it yourself with our support, or simply take the licences in the right formula.


/CASE
Phronesys, a Belgian SaaS company, helps her customer digitize all their QHSE processes in one platform. Each customer is fully isolated and runs a separate Kubernetes space. As it scaled past 400 clients, its data-volume monitoring bill kept climbing. Moving to Instana gave Phronesys predictable per-host pricing and full visibility from the mobile app to the data layer, with customer onboarding fully automated.
~1/3
of previous monitoring cost
+
SAAS customer environments monitored
%
automated customer onboarding
End-to-end
mobile app to data layer
/CONTACT
See Instana at work. We start with a short intake call and a live demo, and take it from there.
/CONTACT
We have a presence in both the Flemish and French region of Belgium and also in Luxembourg.