/SERVICES
Every operations team knows the meeting. The application is slow, users are complaining, and three teams sit around the table, each with a dashboard that says their part is fine. The network team points at PRTG, the platform team at CPU graphs, the developers at their code. Meanwhile the clock keeps ticking.


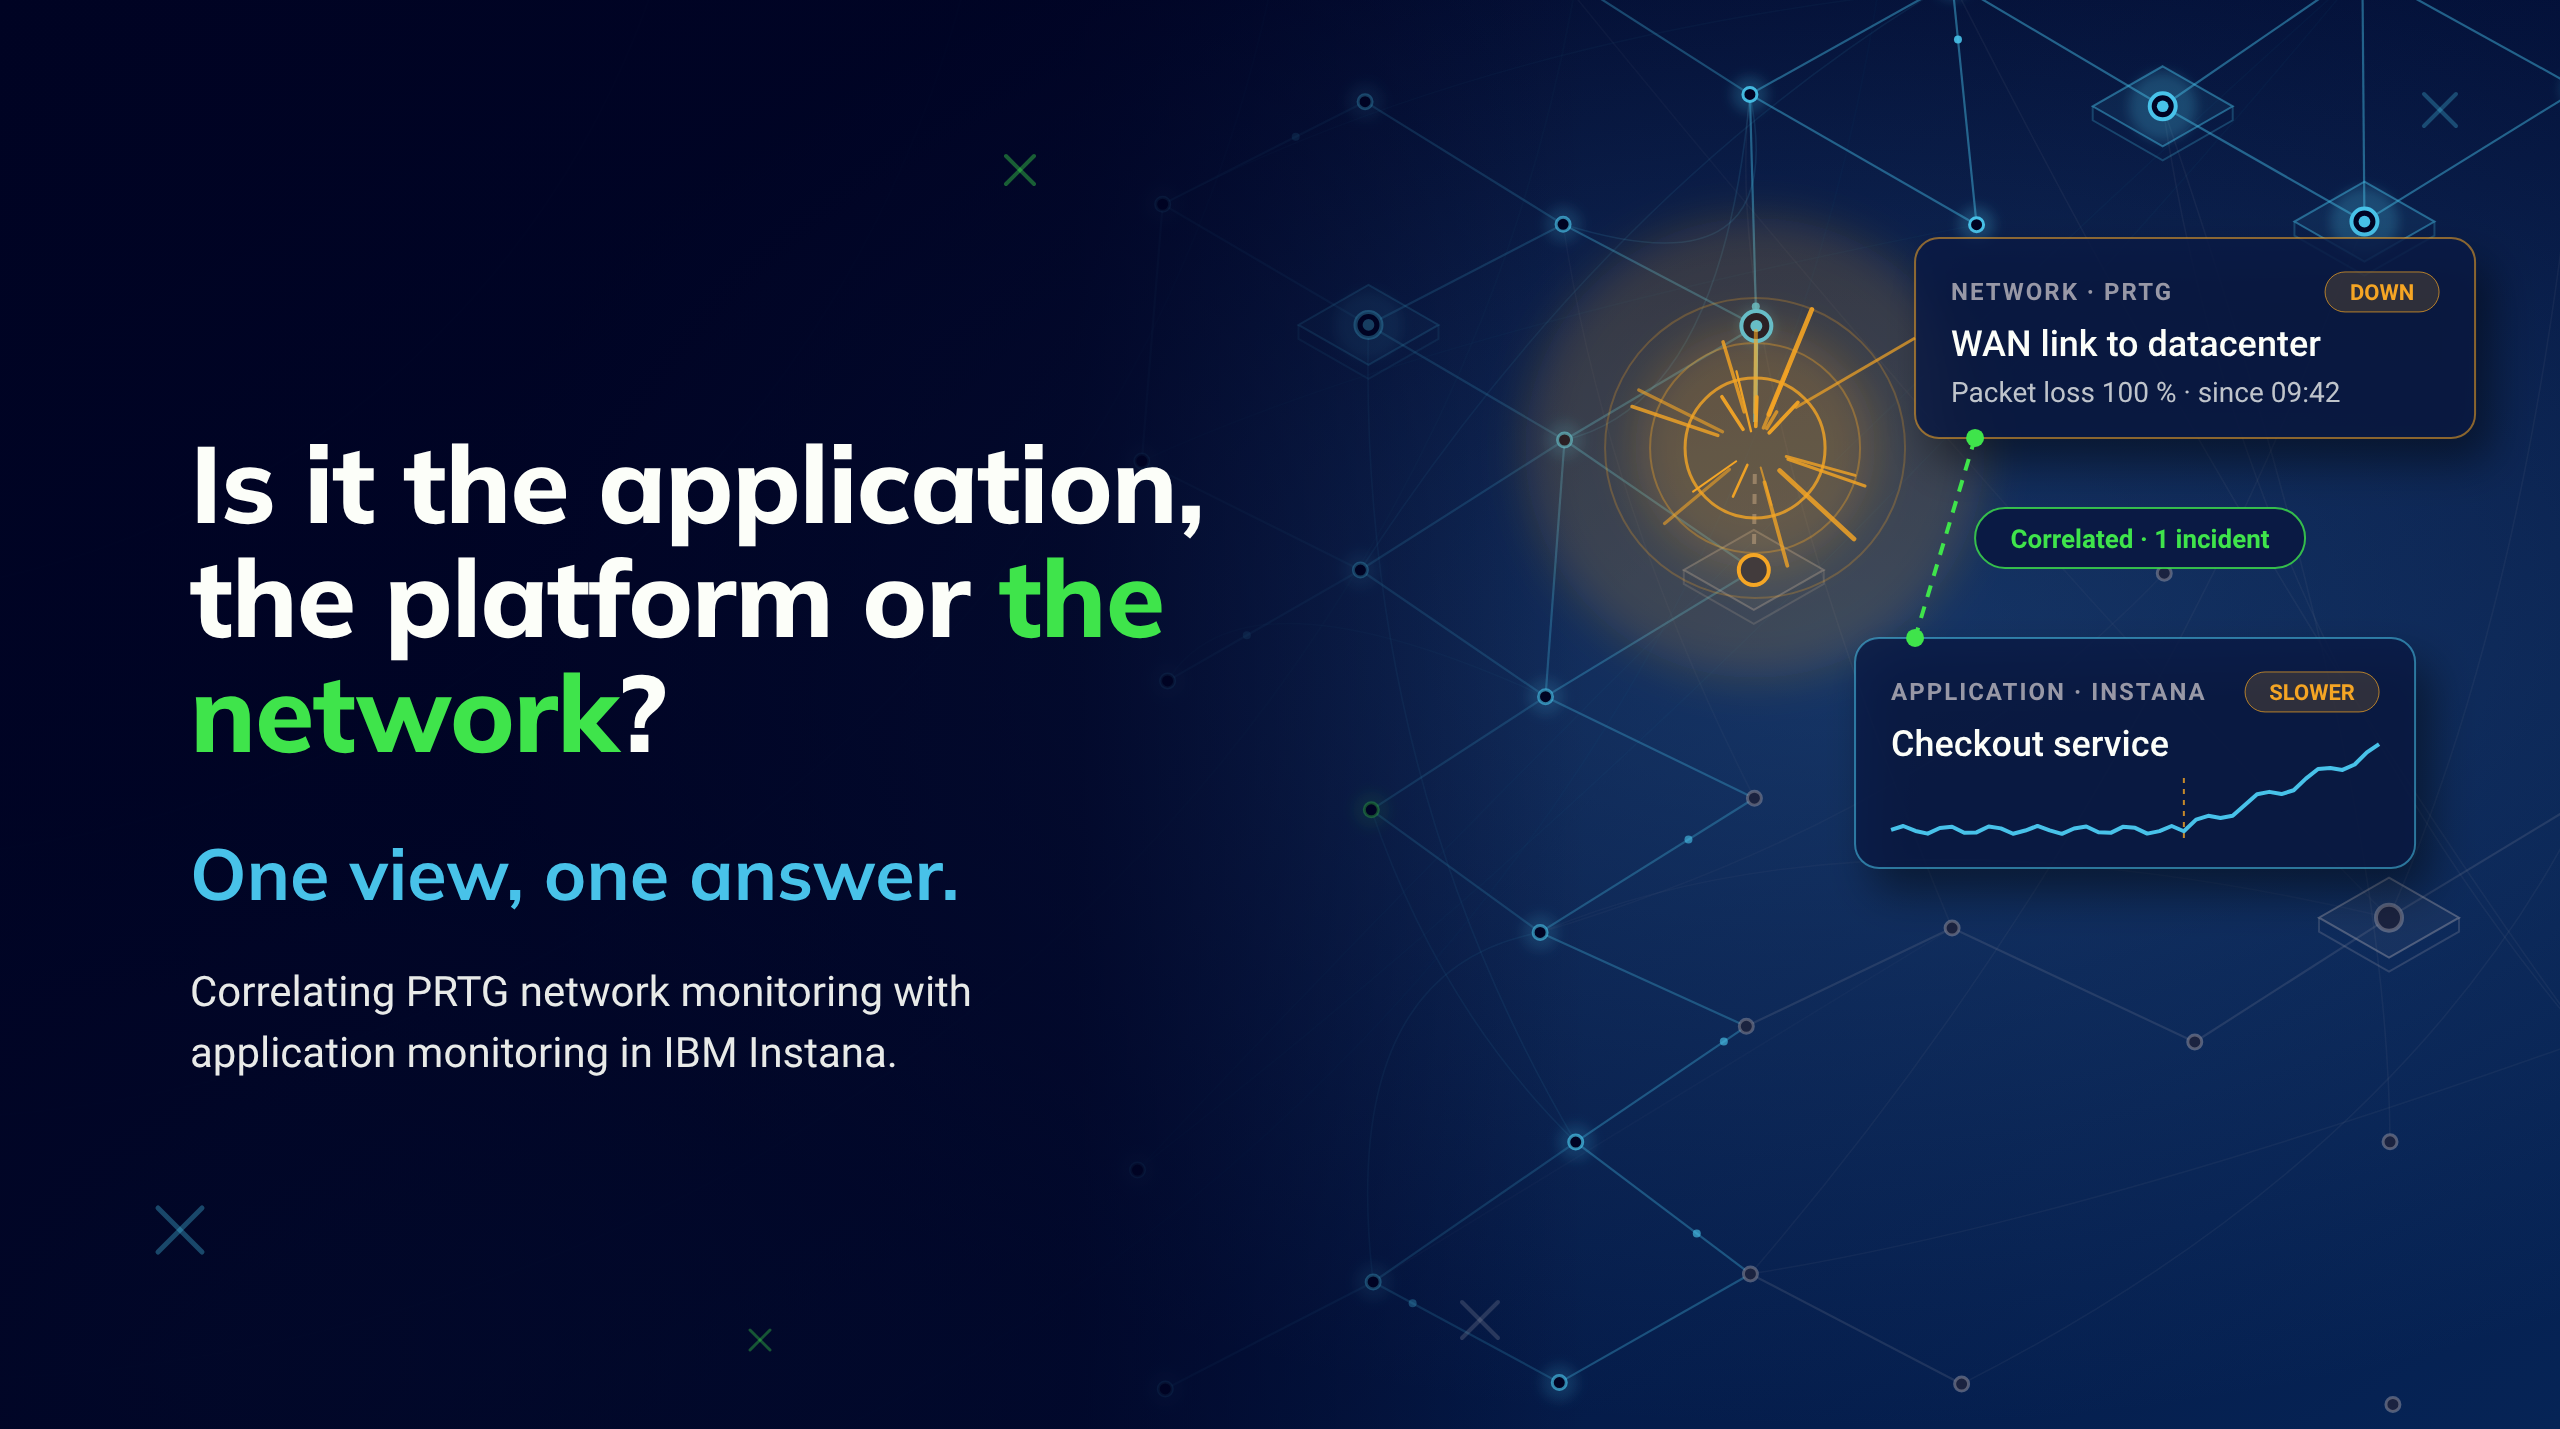
The problem is rarely a lack of data. Most organisations monitor their network, their servers and their applications quite well. The problem is that this data lives in separate tools, with separate timelines and separate alerting. Nobody sees the whole chain, from the network link to the user who is waiting, in one place.
In this post we take that meeting as our starting point, rebuild it in our lab with IBM Instana, and show what it takes to answer the question in minutes instead of in a meeting, and what that means for the business.
This is the second post in our observability series. In the first one, Stop Guessing Thresholds, we looked at how Smart Alerts with adaptive thresholds cut down false positives. Here we look at what happens after an alert fires: finding the cause.
An unclear root cause is not just an annoyance for IT. The outage lasts longer, because every minute spent deciding whose problem it is, is a minute the application stays slow for customers or colleagues. It burns expensive people: five engineers in a call for an hour is five hours of senior time, and it happens again with the next incident. And it damages trust. When teams or suppliers keep pointing at each other, management loses confidence in IT. In a managed services relationship, not being able to show who owns a problem is one of the fastest ways to sour a contract.
A typical setup looks like this. PRTG, or a similar tool, watches ping times, packet loss and interface traffic. An APM or infrastructure tool watches hosts and services. Each tool raises its own alerts, and each alert lands in its own channel.
When something breaks, someone has to line up the timestamps by hand. Did the latency spike start before or after users started to complain? Was the application slow because of the network, or was the network busy because of a backup? That manual correlation is where most of the time to resolution goes.
There is a second blind spot. Server-side monitoring measures how fast the application answers once a request arrives. It does not see the time a request spends on the way there. When the network is the problem, the APM dashboard can stay green while users wait.
The fix is not to replace your network monitoring. It is to bring its signals into the same place as your application data, next to a measurement of what the user actually gets. We use PRTG as the example, because it is what we see most often at customers, but the approach is the same for Zabbix, Checkmk or any tool that exposes its data through an API. Three kinds of signals come together in Instana.
In our lab, a small web application runs behind a firewall on a host with the Instana agent. A script plays the role of PRTG: every 30 seconds it measures latency, jitter and packet loss to the gateway and two public endpoints, and raises an event at 40 ms (warning) and 100 ms (critical). A synthetic test calls the application every minute from a point of presence on the other side of the WAN link. Normally the user gets an answer in about 40 ms.
Then we degraded the WAN link: 150 ms of extra delay and 3 % packet loss, for about twelve minutes. This is what Instana showed.
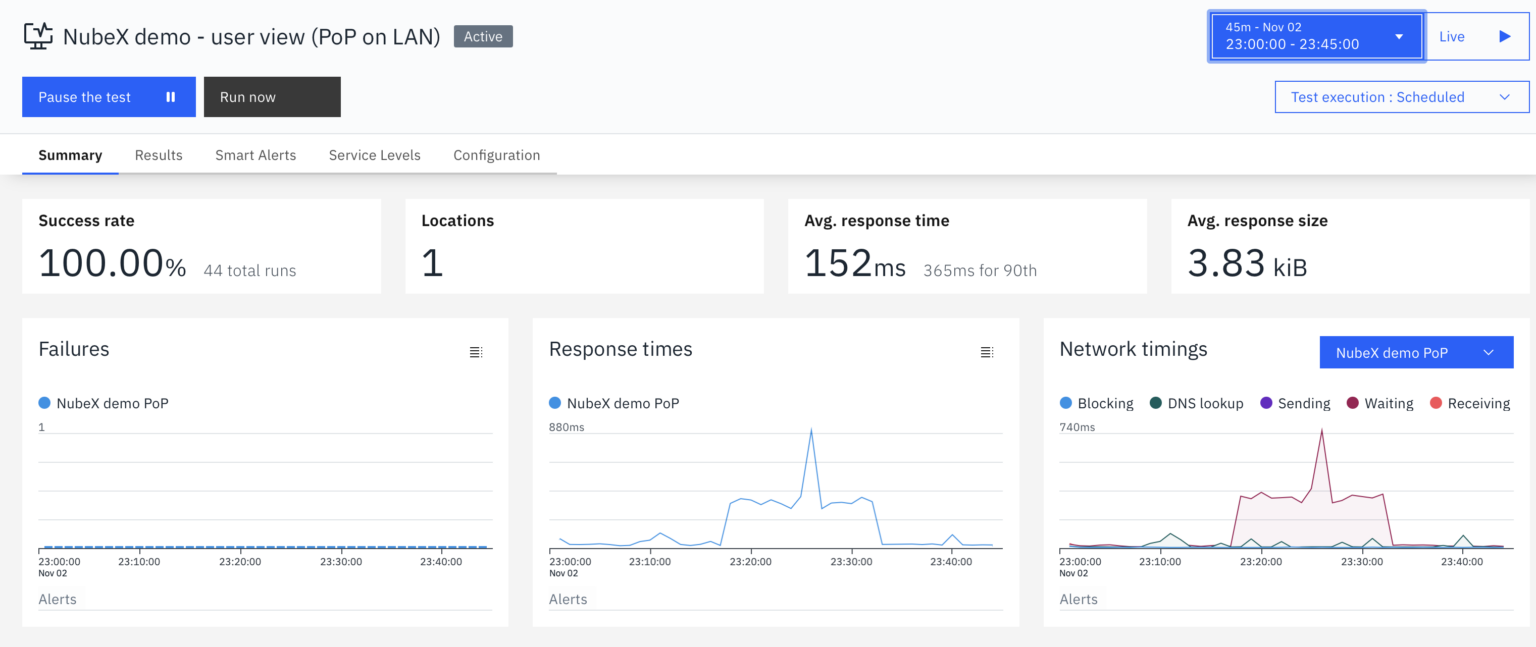
The user view: the synthetic test in IBM Instana. Response times climb to between 500 and 880 ms, and the network timings show the time is spent waiting.
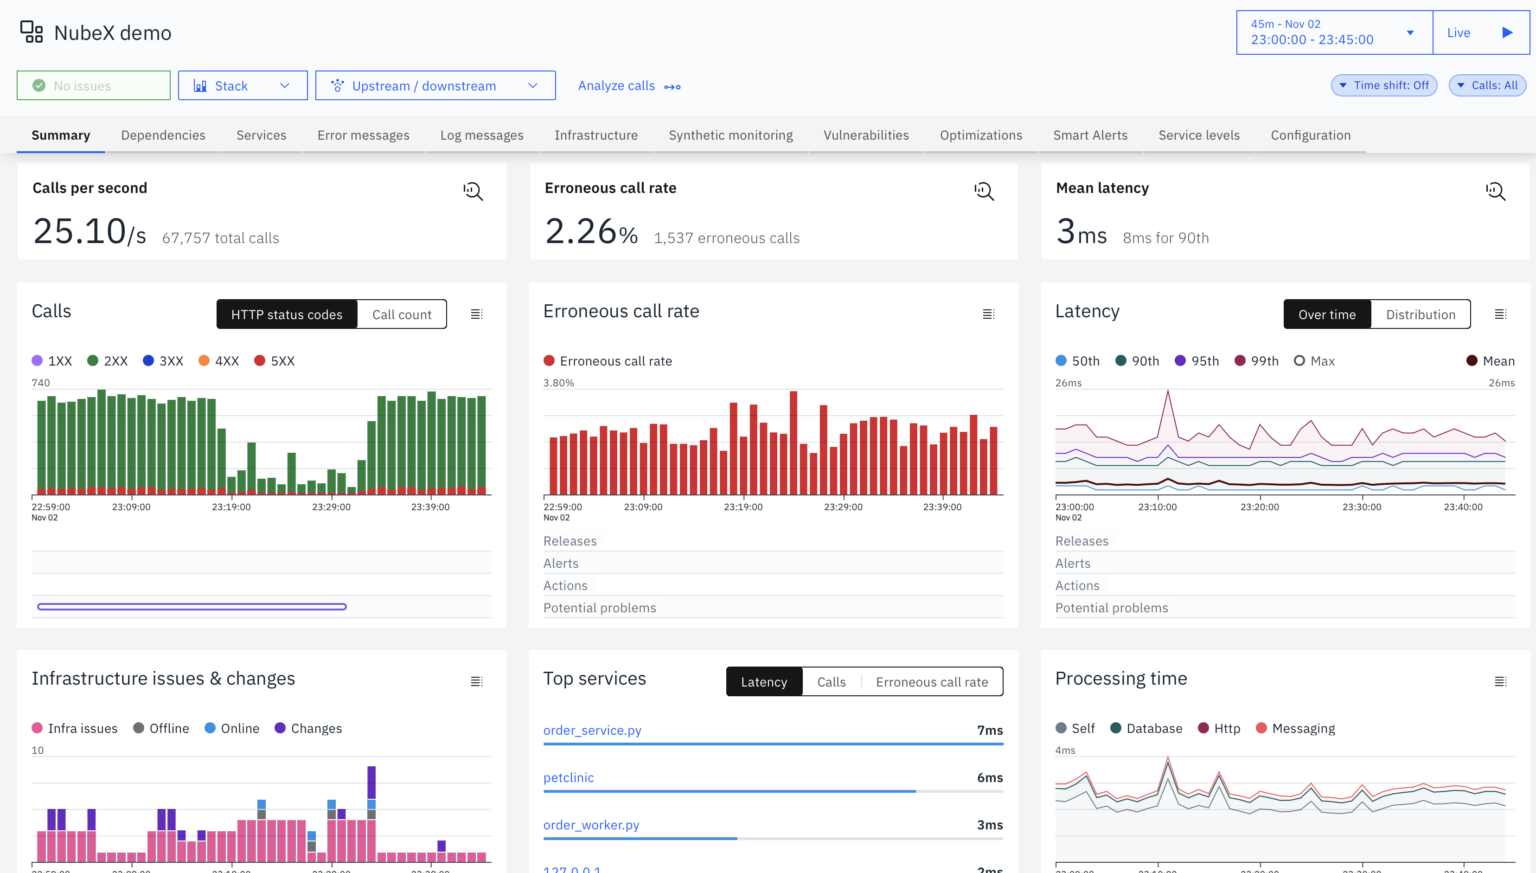
The server view of the same period: the application reports "No issues" and a mean latency of 3 ms.
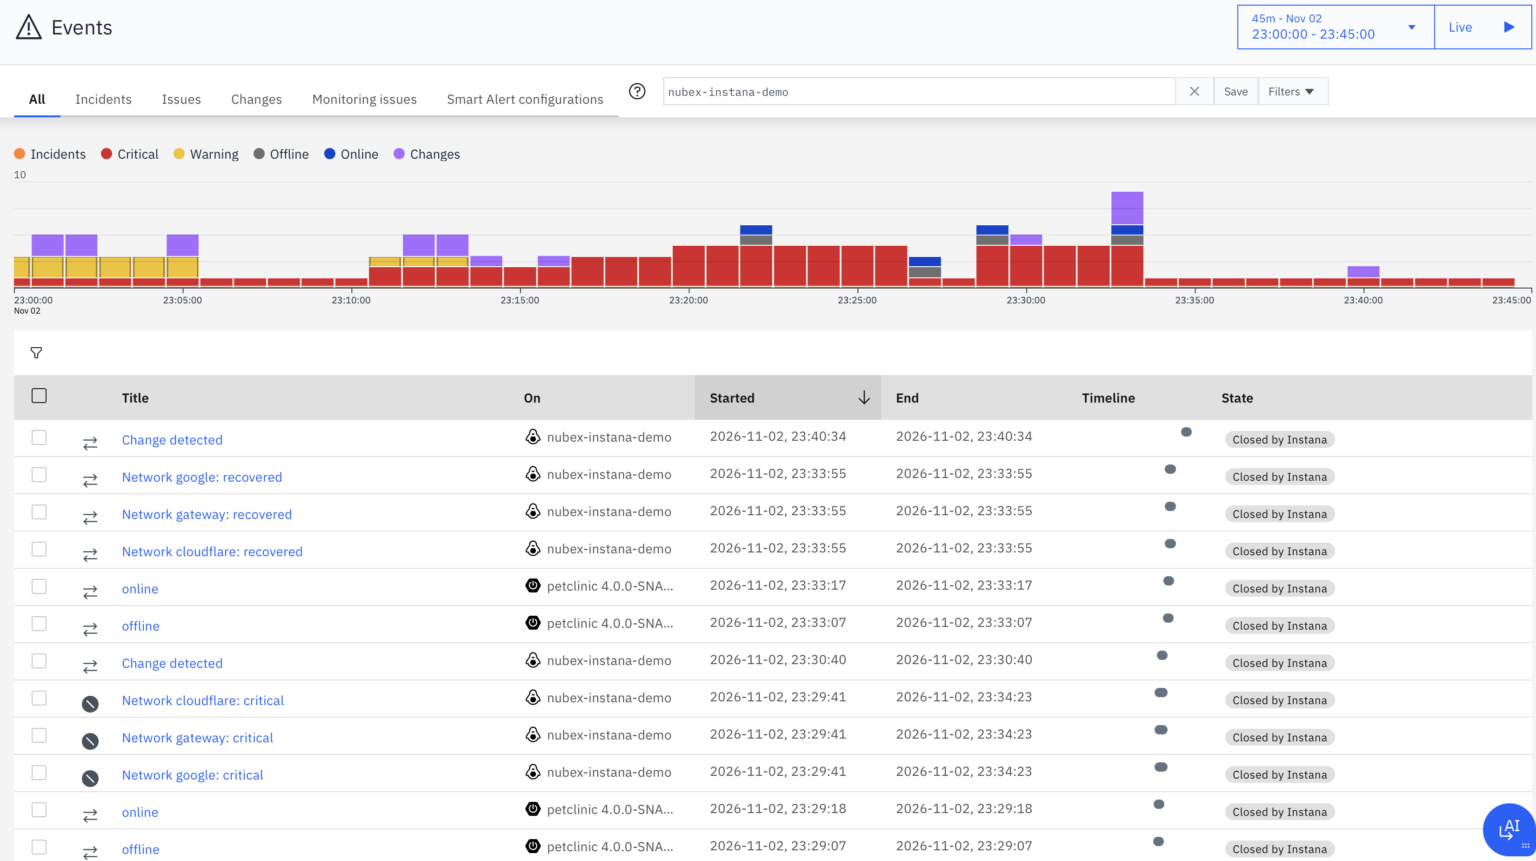
The network events on the host: critical latency to the gateway and the public endpoints, and the recovery when the link was restored.
The order of events tells the story. In one of our runs, the network probe raised a critical event 24 seconds after the link was degraded. Less than two minutes later, the Smart Alert on the synthetic test fired because users were getting slow responses. All that time, the application itself kept answering in a few milliseconds. Three views, one time axis, and the conclusion is clear within minutes: the application is fine, the network is not, and the network team can start working on it right away.
One view, one timeline, no guessing.
We want to be precise here, because this is where marketing and reality often drift apart.
That is still a big step forward from three tools and a meeting room. And it shows why the user view matters: without the synthetic test, this incident would have looked like nothing at all on the application side.
The most useful lesson from the lab is not about the network. It is about where you measure. A server that answers in 3 ms means nothing to a user who waits 800 ms. Synthetic tests measure the full trip, including the parts you do not own: the WAN link, the internet provider, the firewall. Put a test on the transactions that matter most, attach it to the application in Instana, and you see user impact even when every server looks healthy.
That changes the conversation. Instead of "all our dashboards are green", the team can say "users are waiting, and here is where the time goes".
At NubeX we help teams connect their existing monitoring to IBM Instana, so every incident gets a clear owner and a faster fix. Want to see the lab scenario live, or what this means for your own environment and tools? Let’s talk, or book a demo.
/CONTACT
/FAQ
/INSIGHTS
Lorem ipsum dolor sit amet, consectetur adipiscing elit. In porta posuere nisi sed blandit. Nam cursus interdum maximus.
/CONTACT
We have a presence in both the Flemish and French region of Belgium and also in Luxembourg.