/SERVICES

Stop Guessing Thresholds: How Dynamic Thresholds in IBM Instana Make Application Alerting Smarter

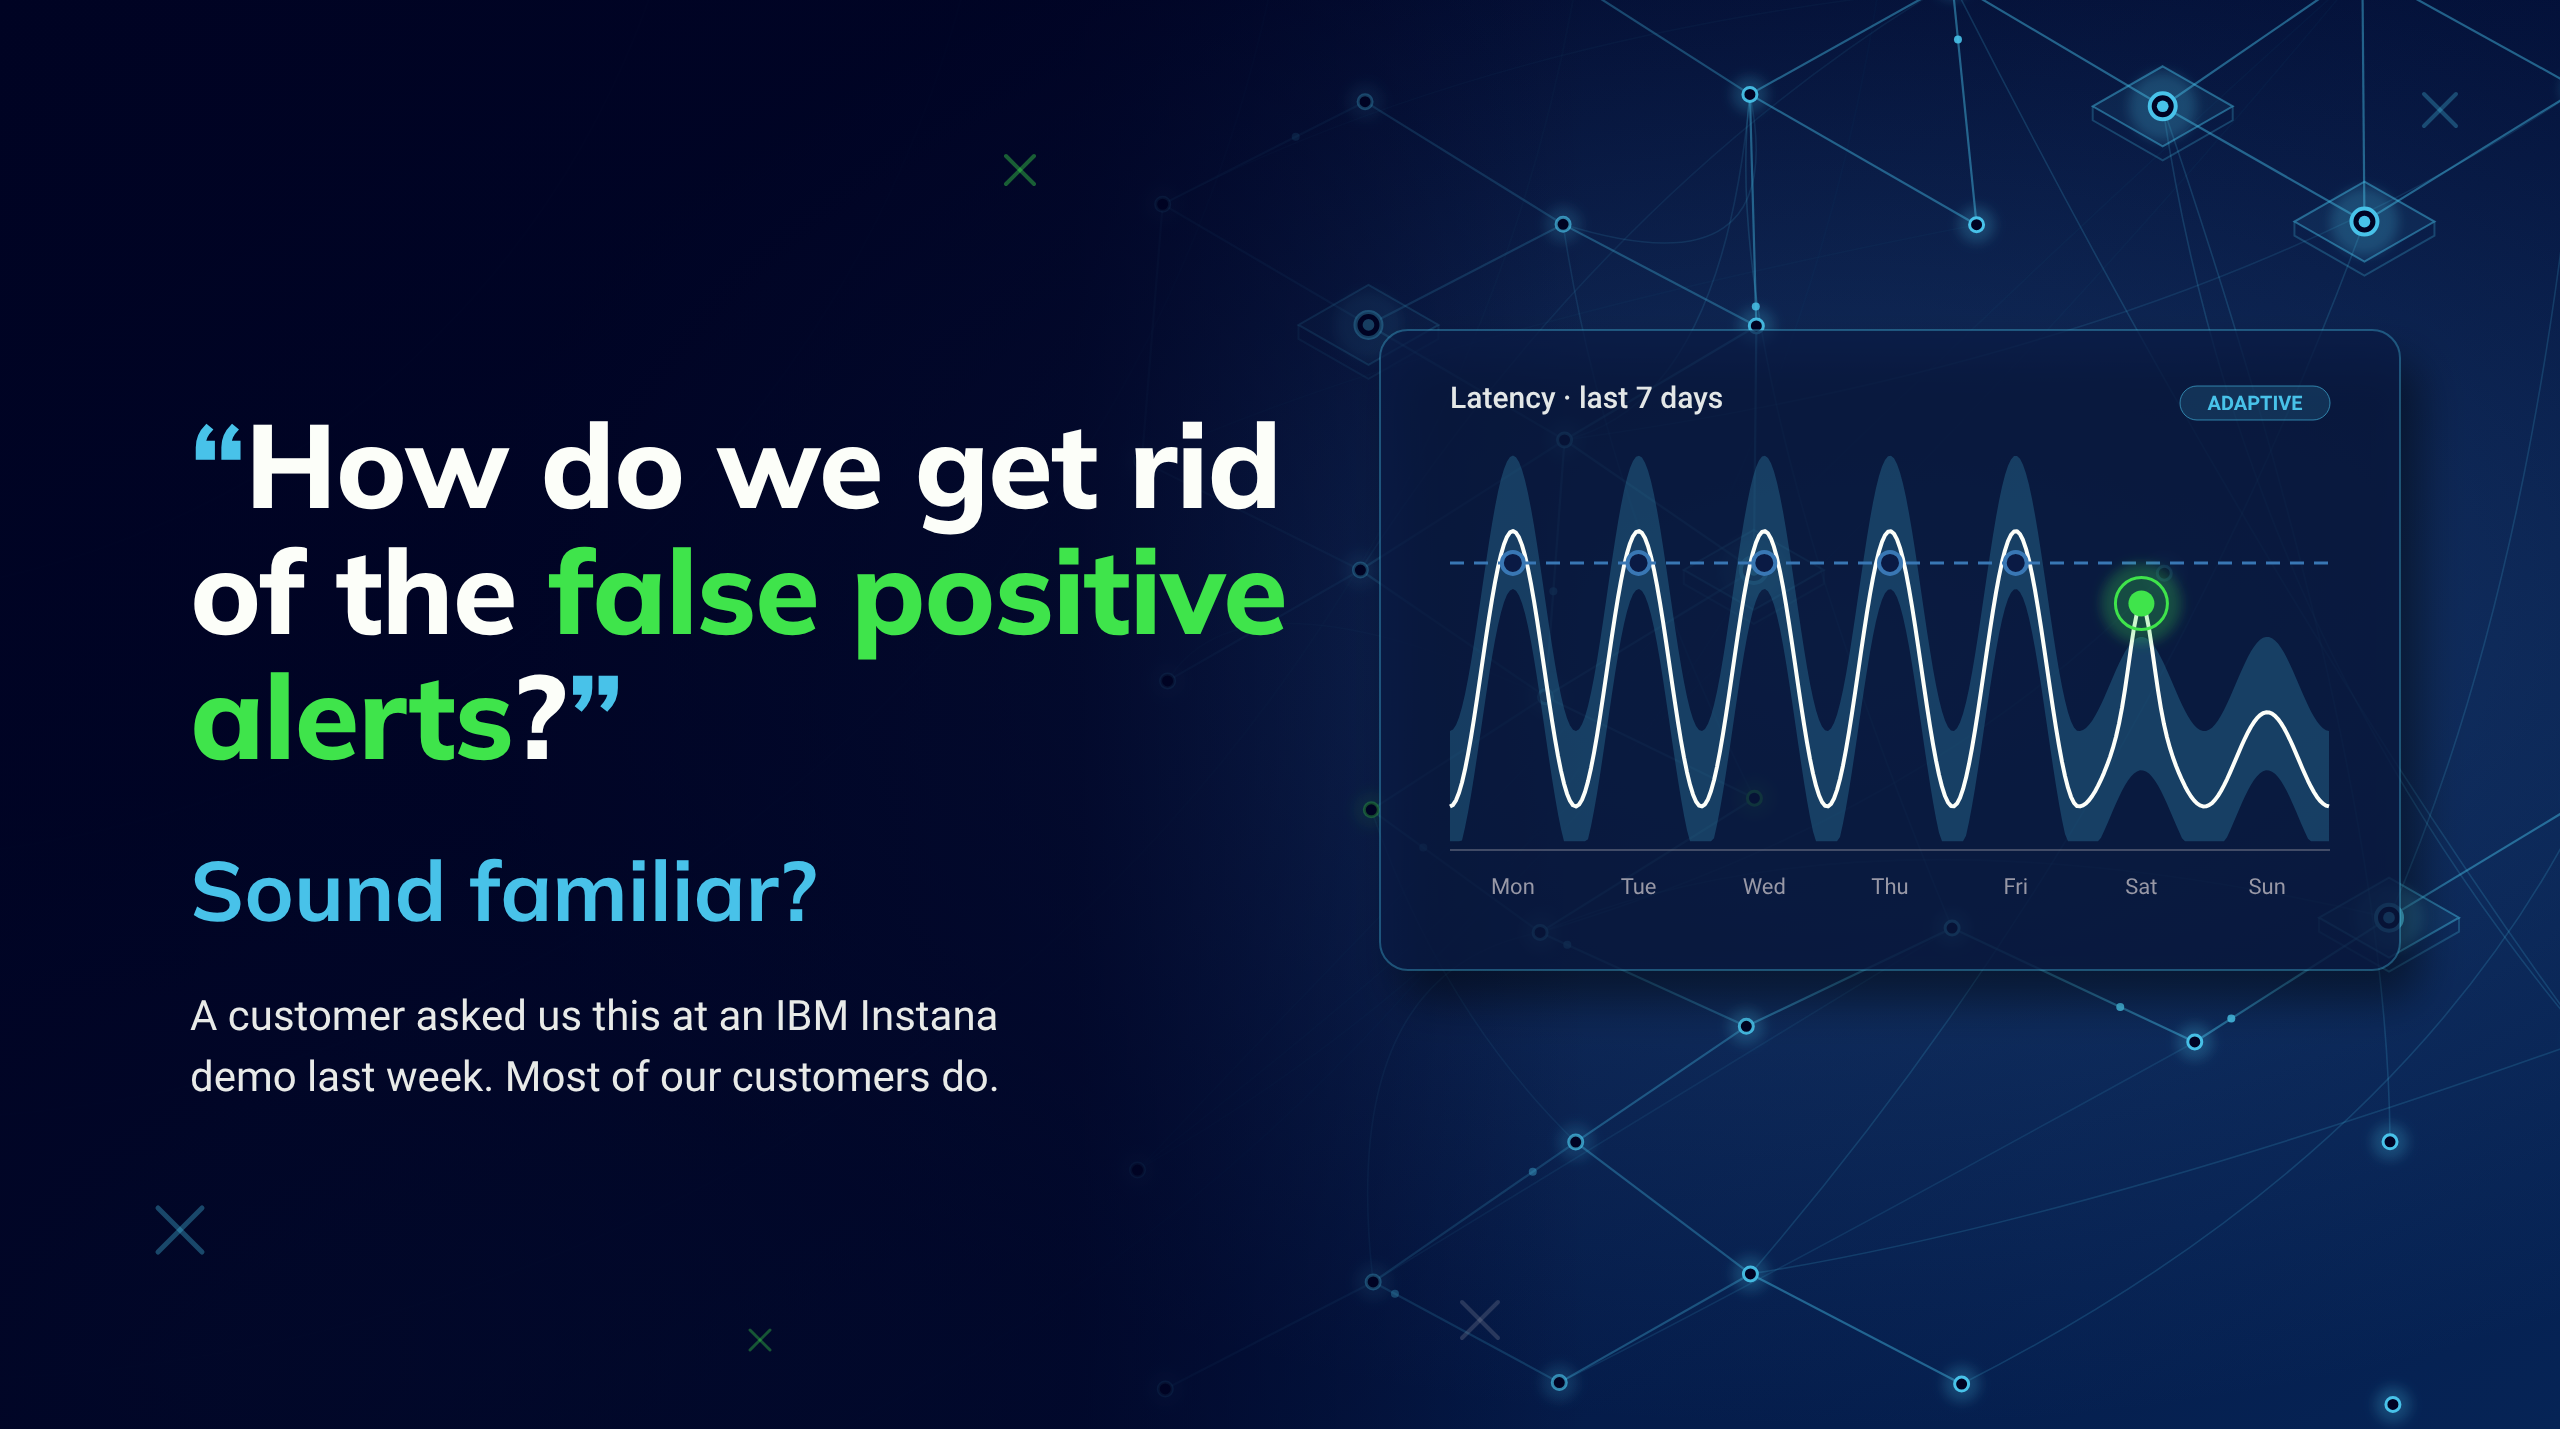
Last week we gave an IBM Instana demo to a customer. Halfway through, the question came that we hear at almost every demo: "How do we get rid of the false positive alerts?" Their team gets paged for alerts that turn out to be nothing, and the one alert that matters gets lost in the noise. 
Adaptive Thresholds That Learn the Seasonality of Your Applications
Fewer False Positives, Less Alert Fatigue
Beyond a Single Service: Smart Alerts on a Combination of Application Service
The cause is almost always the same. Somewhere in the monitoring tool there is a threshold that says "alert when response time goes above 500 ms". Someone picked that number years ago. Since then the application changed and traffic doubled. The number did not.  In this post we take that customer question as our starting point and show how Smart Alerts in IBM Instana help to answer it, and what that means for the business. 

What alert noise really costs 

Bad thresholds look like a technical detail, but the bill lands somewhere else. Noise costs attention: when engineers keep getting paged for nothing, they learn to ignore alerts, and sooner or later the real incident gets ignored too. Noise costs people: night after night of pointless pages is one of the quickest ways to burn out a good engineer. And static thresholds cost maintenance: with a hundred applications, revisiting every number after every change is a job nobody gets to. 

The trouble with fixed numbers 

Applications do not behave the same way all day, or all week. Response times at 9 on a Monday morning look nothing like 3 at night or a quiet Saturday. A single fixed threshold cannot follow that rhythm, so it fails in both directions. Set it high enough to stay quiet on a busy Monday and it sleeps through a spike on a quiet Saturday. Set it lower and every Monday becomes an incident.  IBM puts it plainly in the Instana documentation: "A static threshold might stop being relevant after the underlying metric changes significantly." A threshold that was right at go-live slowly becomes wrong, and nobody notices until the alerts lose their meaning. 

What an adaptive threshold does 

An adaptive threshold does not ask you for a number. Instana learns what normal looks like for a metric, including its daily and weekly rhythm, and draws a band around that expected value. An alert fires only when the metric leaves the band. A busy Monday is normal. A busy Saturday is not. 
  • Sensitivity is set in standard deviations. A lower value gives a tighter band and more alerts, a higher value a wider band and fewer alerts, with separate values for warning and critical. 
  • It needs some history. For infrastructure Smart Alerts, Instana needs at least six hours of continuous data. For application Smart Alerts, adaptive baselines are still a beta feature and need at least 14 days of data. 
  • You can preview it. Before you save the alert, Instana shows the thresholds on top of the last 24 hours or 7 days of real data, so you see which alerts it would have raised. 
  • Not ready for adaptive yet? For application Smart Alerts, Instana can suggest a static threshold based on history, with daily or weekly seasonality. 

An example from our demo 

In our demo environment we set an adaptive Smart Alert on slow calls for the Robot Shop sample application. The preview below covers the last seven days. The warning and critical thresholds rise and fall with the daily rhythm of the application, every single day.    Smart Alert preview in IBM Instana: slow calls on the Robot Shop demo application, last 7 days, adaptive threshold selected.  Over those seven days, the alert would have fired exactly once: on the latency spike of 30 October, the one moment the application really behaved differently. Seven days, one alert, and it is the one you want. Tightening or loosening the sensitivity is a matter of moving one value and checking the preview again.  Normal changes. Your thresholds should too. 

When to use static and when to use adaptive 

Adaptive thresholds are not a replacement for every alert. We usually combine both. 
  • Use static thresholds for hard limits: a disk that is 95 % full, a certificate that expires in seven days, an SLA that defines an exact response time. 
  • Use adaptive thresholds for metrics with a pattern: response times, throughput, latency, queue length and resource usage that moves with the business day. 
Combined with the incident correlation in Instana, this gives fewer but better alerts. 

Alert on what your users feel 

Fewer false positives is half the story. The other half is alerting on what actually matters to the business. A server at 85 % CPU is not a problem if nobody notices. A checkout that takes six seconds is, even when every server looks healthy.  Instana lets you alert on that user impact directly. Apdex Smart Alerts fire when the Apdex score, a standard measure of user satisfaction between 0 and 1, stays below a level you choose for a set time window. Smart Alerts on service level objectives warn you when the error budget is being used up too fast, when a set share of it is gone, or when the SLO status drops below target.  That changes the conversation. Instead of "server X is busy", the alert says "customers are getting a worse experience than we promised", which is exactly what management and SLA owners care about. 

What it brings to the business 

  • Fewer, better alerts. Teams act on what fires, because what fires is worth acting on. 
  • Problems spotted earlier. A metric that drifts away from its own normal is often the first sign of trouble, well before a hard limit is reached or users start to complain. 
  • Less tuning work. Thresholds follow the application as it grows and changes, so nobody has to chase the numbers after every release. For a managed services provider, this is what makes good alerting affordable across many customers. 
  • The same quality everywhere. Smart Alert definitions can be exported, checked and imported as JSON files with the stanctl-integration CLI from IBM. A good alert set is built once and rolled out to every environment or customer, instead of being rebuilt by hand. 
Better alerting is one of the building blocks of shorter incidents. Among its customer stories, IBM lists the Oregon Health Authority, which reports a 30 % reduction in mean time to resolve with Instana. 

How to get started 

  1. Pick two or three metrics where your team gets the most noisy alerts today. 
  1. Make sure Instana has at least six hours of data on them, preferably a few days. 
  1. Create a Smart Alert with an adaptive threshold and use the preview to set the sensitivity. 
  1. Run it next to the old static alert for a week and compare which one your team would rather keep. 
  1. Add an Apdex or SLO alert for the services your customers use most, then export the set and reuse it for the next application. 

Key Takeaways 

  • Static thresholds go stale and create noise, missed incidents and maintenance work nobody plans for. 
  • Adaptive thresholds in Instana Smart Alerts learn normal behaviour and alert on real deviations, with a preview to tune them before saving. 
  • Apdex and SLO Smart Alerts let you alert on what users experience, not just on what servers do. 
  • The business gets fewer but better alerts, earlier warnings and on-call teams that stay motivated. 
  • Keep static thresholds for hard limits and use adaptive ones for metrics with a daily or weekly rhythm. 

Let's talk! 

At NubeX we help teams cut alert noise and turn IBM Instana into monitoring the business can rely on. Asking the same question as our demo customer? Let’s review your alerts together, or book a demo.   

/CONTACT

Get in touch!

Subscribe to our newsletter*

/FAQ

FAQ - ipsum dolor sit amet

Lorem ipsum dolor sit amet, consectetur adipiscing elit. In porta posuere nisi sed blandit. Nam cursus interdum maximus. 

Lorem ipsum dolor sit amet, consectetur adipiscing elit. In porta posuere nisi sed blandit. Nam cursus interdum maximus. 

Lorem ipsum dolor sit amet, consectetur adipiscing elit. In porta posuere nisi sed blandit. Nam cursus interdum maximus. 

Lorem ipsum dolor sit amet, consectetur adipiscing elit. In porta posuere nisi sed blandit. Nam cursus interdum maximus. 

/INSIGHTS

Related insights - dolor sit amet, consectetur adipiscing elit 

Lorem ipsum dolor sit amet, consectetur adipiscing elit. In porta posuere nisi sed blandit. Nam cursus interdum maximus.

Your trusted partner for Cloud Neutral Platform Managed Services

/NAVIGATION

BTW BE 0677.419.096

/CONTACT

We have a presence in both the Flemish and French region of Belgium and also in Luxembourg.